
Thornlands Market Report Q3 2026 | Billy Gray
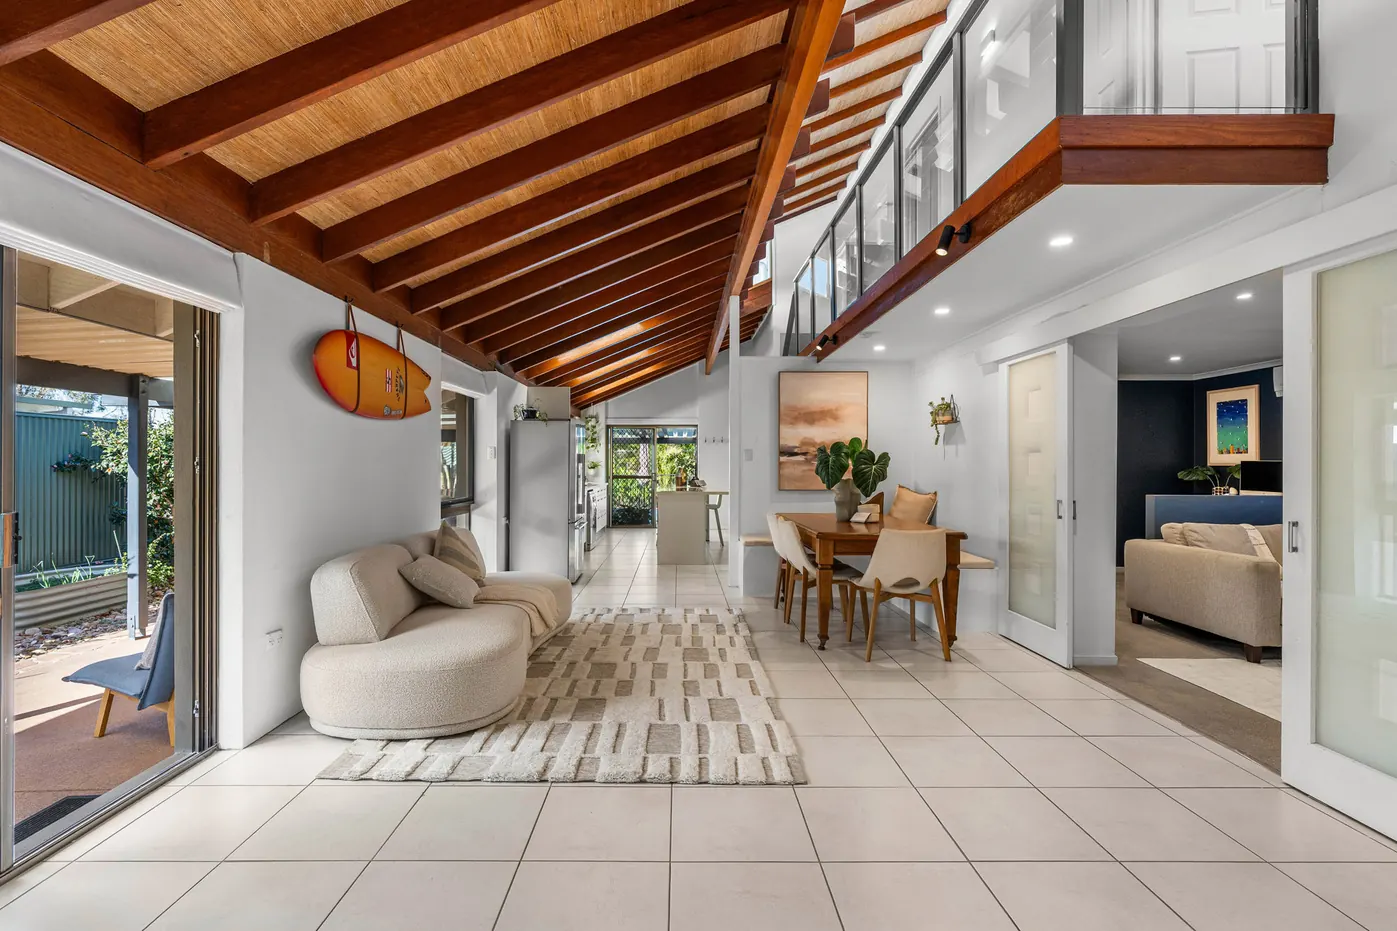
Open plan living and dining area under exposed timber ceiling beams

Q3 2026 · Thornlands

Thornlands Market Report

An honest update on what's happening in Thornlands.

Download the full reportQ3 2026 · 12 pages · PDF · 0.7 MB

Download PDF

Market Update.

Q2 was the biggest shift I'd seen in our market in years. Q3 has only reinforced it.

Buyer numbers through open homes remained soft, new listings are increasing as we move into spring, and buyer confidence has taken a hit.

There are more properties competing for attention, fewer active buyers, and those buyers have considerably more choice than they did six or twelve months ago. They're taking their time, comparing properties carefully and becoming far more selective about where they see value.

One positive point is we saw a large pick-up in interstate buyer enquiry throughout the quarter.

Importantly, some property types are holding up considerably better than others. I'll break down exactly where we're seeing strength and weakness later in this report.

Execution is now more important than ever, and owners that miss the key steps of presentation, marketing and pricing are getting ignored by an unforgiving buyer pool.

Conditions on the buying side are the most favourable we've seen in years. There's less competition and far more room to negotiate.

Personally, I think too many sellers are focused entirely on what they might give up on their sale without considering what they could potentially gain on their purchase.

If you're in a strong buying position, finding a motivated seller whose property has been poorly positioned can create opportunities to buy $100,000 or more below asking price.

For many homeowners looking to make their next move, that can make the changeover equation far more attractive than the headlines suggest.

Speak soon, Billy.

One Suburb. Two Very Different Markets.

Small lot homes

300 to 550m²
10 to 15%Estimated fall from peak

I first touched on the emerging supply issue in my Q2 report. Since then, we've seen how that imbalance has played out, with small-lot homes experiencing some of the steepest price falls in Thornlands.

With so much competing stock and a limited buyer pool, owners have been forced to make significant price adjustments. More concerningly, even some of the cheapest homes in this segment are still not transacting.

Small-lot homes remain 60% more heavily supplied than established homes, relative to the number of properties in each segment.

Putting an exact figure on the decline is difficult, particularly because the headline median price data doesn't reflect what is happening in real time. Instead, I ask a simpler question: what would this same home have realistically sold for at the peak of the market?

It's something many agents are reluctant to say publicly, but based on the transactions, competing stock and properties currently sitting on the market, I believe values across parts of the small-lot segment have conservatively fallen by around 10 to 15% from their peak.

Established residential

550 to 1,000m²
3 to 8%Estimated fall from peak

If you own a home in this category, the picture is considerably more positive. That doesn't mean established homes are immune to the broader market shift, but the decline in values has generally been far less severe.

The biggest difference is variety and scarcity. Unlike small-lot homes, which can be very similar in age, design and block size, established Thornlands offers a much wider mix of homes, land sizes, renovations and features.

This makes it harder for buyers to compare properties directly and means one owner reducing their price doesn't necessarily reset expectations for every competing home.

We're also seeing a resurgence in interstate buyer activity within this segment, which is an encouraging sign.

Depending on the property, location and overall offering, I believe established home values have generally fallen somewhere in the vicinity of 3 to 8% from their peak.

Why there's no data in this report.

You might notice that there's something missing from this report.

There's no median sale price, no median days on market, no quarterly growth percentage. That's deliberate.

Normally, these statistics are useful for understanding the direction of the market, but during a rapidly changing market, there can be a significant gap between what the published data says and what buyers and sellers are experiencing right now.

The reason is simple: property data is always playing catch-up.

A sale can take months from going under contract to settling and reaching the property records that form the headline data, and this means the data can effectively be looking 3 to 6 months in the rear-view mirror.

Days on market can be equally misleading. It only tells us how long the properties that sold took to find a buyer. It doesn't accurately account for homes that sat for months, withdrew from the market, or found success on their second campaign after being relaunched.

Right now in Thornlands, I believe the gap between published data and the market on the ground is simply too large for me to present those headline figures to you as an accurate picture of the current conditions.

There's another problem with suburb-wide statistics: they don't necessarily reflect your type of property.

As I explained earlier in this report, there are markets within the market. A small-lot home can be experiencing very different conditions to an established home on a larger block, yet both transactions ultimately feed into the same Thornlands headline figures.

So rather than fill this report with statistics that I don't believe accurately represent what's happening today, I'd rather focus on what I'm actually seeing on the ground.

Common Questions.

What we are hearing right now from Thornlands owners.

“Should I wait for the market to recover before selling?”

It depends on what you're doing next. If you're selling and buying in the same market, waiting for your home to recover can also mean paying more for the property you're moving into. If you're exiting the market altogether, the decision is different, and you need to consider how long you're willing to hold for, and if there's other opportunities to deploy that capital. I'd focus less on trying to time the exact bottom and more on whether selling makes sense for your circumstances.

“Why are some homes still selling quickly, yet others take months?”

Buyers haven't disappeared altogether, but they've become more selective. With more properties to choose from, homes that are well presented, marketed properly and priced in line with today's market are still attracting good interest. The properties struggling are generally those where buyers believe there is better value elsewhere.

“Should I start high and reduce the price if I need to?”

That strategy carries more risk in this market. Your strongest audience is usually there when the property first launches. If buyers immediately feel the price is too high, you can miss that initial window and end up chasing the market down. I'd rather price strategically from day one and give buyers a reason to engage.

“How much have Thornlands prices actually fallen?”

There isn't one number that accurately represents Thornlands right now. Small-lot homes have been hit considerably harder due to the amount of competing stock, while established homes have generally been more resilient. Based on what I'm seeing transact and compete today, I believe parts of the small-lot market are down around 10 to 15% from their peak, compared with roughly 3 to 8% for established homes, depending on the property and location.

What I'm watching next.

These factors will give us a heat check on the market.

  1. 01

    Will the spring stock make things worse?

    This is probably the biggest one. Listings were already increasing through Q3, and we're heading into the time of year when more owners traditionally come to market. If stock continues building without a corresponding lift in buyer numbers, I expect conditions to remain difficult, particularly for small-lot homes where supply is already disproportionately high. On a positive note, the early spring market has not seen this happen.

  2. 02

    Do interstate buyers keep coming back?

    One of the more encouraging signs from Q3 was the noticeable increase in interstate enquiry, particularly across established homes. I'll be watching closely to see whether that continues and, importantly, whether that enquiry starts translating into more transactions. A deeper buyer pool would be a genuine positive heading into the end of the year.

  3. 03

    Where does the small-lot market find its floor?

    This segment still concerns me most. We're now seeing significant price adjustments and, in some cases, even the cheapest competing properties aren't selling. The first sign of stabilisation won't necessarily be prices rising but stock beginning to clear, fewer reductions and correctly priced homes consistently finding buyers.

  4. 04

    When do buyers start feeling urgency again?

    Right now, buyers know they have time. They're comparing everything, negotiating hard and walking away when they don't see value. The shift I'm looking for is when that behaviour starts changing with more competition at open homes, multiple buyers pursuing the same property and a greater fear of missing out. Markets can turn very swiftly, so I'm watching this closely as a sign the market is back.

Special offer for all Thornlands owners

Selling in Q4?

For all listings signed in Q4 of 2026, I'll cover the cost of your:

  • Form 2 Seller Disclosure Statement
  • Pre-sale building and pest inspection

Having everything completed before we launch means fewer surprises once a buyer is found, gives us the opportunity to address any issues upfront, and puts us in a stronger position when it comes time to negotiate.

It's one less thing for you to organise, one less cost to worry about, and another step towards making sure your property is properly prepared for the market.

Book an appraisal and mention this report to claim this offer.

Offer applies to new Thornlands listings signed between 1 October and 31 December 2026. Terms and conditions apply.

Thornlands Rankings.

  • #1Most houses sold21 houses sold in 12 months
  • #1Agent for median priceOut of the top 5 agents
  • #1Lowest days on market8 days on market

12 months of data from REA (current at 30 September 2026).

Book an appraisal with Billy.

Find out where your home sits in today's market. Someone from Billy's team will reach out the same business day.